Guides
What a Slow Store Costs You: A Worksheet With Your Own Numbers
November 7, 2026 - by Alexandru-Manuel Carabus
Three numbers from your store, one formula and one multiplier from a public study: 8.4% more retail conversions for a mobile site 0.1 s faster. A correlation, not a promise, with an example on an invented store.
A slow store doesn't send an invoice. There is no "speed" line in the sales report, and the shopper who gave up after the third slow page leaves no trace. That is why the conversation about speed usually stays at the level of scores.
The worksheet below moves it to money. You use your own store's numbers and a single multiplier from a public study, presented for exactly what it is worth: a correlation, not a promise. All you need is access to Google Analytics and the Magento admin.
What you need: three numbers, from phones
The study we use as the multiplier measures mobile sites, so the worksheet only uses phone visits too. Take the same month for all three numbers:
- Phone visits per month. In Google Analytics 4, sessions filtered on the "mobile" device category.
- Phone conversion rate. Purchases on phones divided by sessions on phones, from the same report. Use the same source for both, so the ratio stays right even if Analytics doesn't see every visit.
- Average order value. From the Magento admin, under Reports > Sales > Orders: the month's sales divided by the number of orders.
Step 1: what you sell on phones today
Multiply the three numbers: visits × conversion rate × average order value. The result is your monthly revenue from phone orders. That is the starting point, and every scenario below is a percentage of it.
Step 2: the multiplier, and why it is a correlation
The study "Milliseconds Make Millions", by Deloitte for Google, followed mobile sites and found that a speed gain of 0.1 seconds went together with 8.4% more retail conversions.
Three things to know before you use the figure:
- It is a correlation. The sites that got faster converted better. The study doesn't say speed alone produced the whole difference, and it doesn't promise the same figure for another store.
- It doesn't add up forever. The study talks about 0.1 seconds. Don't multiply 8.4% by 20 for a site that is 2 seconds faster.
- It is an average of other stores, not of yours.
That is why the worksheet below has two scenarios: the study's figure, 8.4%, and half of it, 4.2%, as the cautious version. If you like, add a scenario where nothing changes. The worksheet is only honest if you accept that one too.
Step 3: an example, on an invented store
The numbers below are invented and belong to no client. We use them only so you can see the worksheet worked through to the end.
- Phone visits per month: 30,000
- Phone conversion rate: 1.2%
- Phone orders per month: 360
- Average order value: 350 lei
- Monthly phone revenue: 126,000 lei
And the two scenarios:
- Cautious, 4.2%: extra orders per month about 15; extra revenue per month 5,292 lei; extra revenue per year 63,504 lei
- The study's figure, 8.4%: extra orders per month about 30; extra revenue per month 10,584 lei; extra revenue per year 127,008 lei
For this invented store, the difference in question is in the order of 5,000 to 10,000 lei a month. It is not a guarantee. It is the order of magnitude that tells you whether speed deserves a serious conversation or not.
Step 4: your own worksheet
Write down your number for each row below:
- A. Phone visits per month
- B. Phone conversion rate, as a number (1.2% = 0.012)
- C. Average order value, in lei
- D. Monthly phone revenue: A × B × C
- E. Cautious scenario: D × 0.042
- F. The study's scenario: D × 0.084
- G. Per year: E × 12 and F × 12
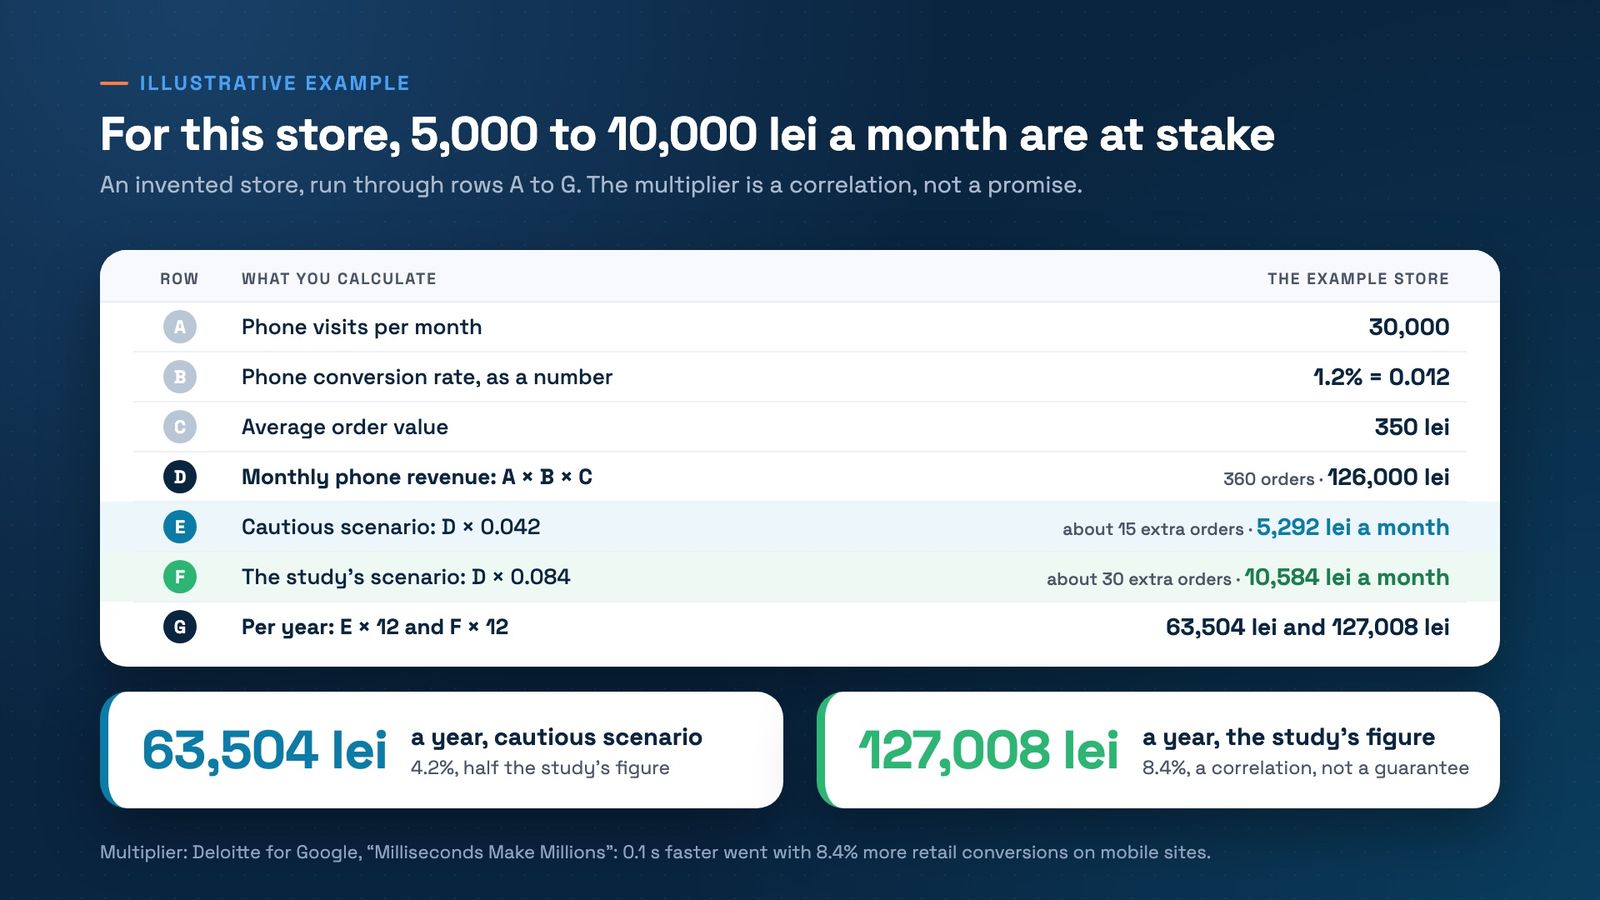
If row G is smaller than what the speed work would cost, you have your answer. If it is bigger, you have a reason to measure.
What the worksheet doesn't tell you
A simple worksheet leaves a fair amount out, and a few things are worth saying plainly:
- Computer visits are not in it, because the study measures phones.
- The average order value is the whole store's, and it stays the same in both scenarios.
- The season matters. A month in November doesn't look like one in February. Use an ordinary month or the average over a year.
- Speed is not the only reason a shopper leaves. Price, delivery and the checkout matter just as much, and the worksheet doesn't separate them.
What the seconds look like in practice
On Equitana we recorded the same 6-step trip, from the homepage to the checkout, on the old Magento 1 store and on the new one. On the old store it took 19.5 s, on the new one 2.1 s. The two category pages alone took 12.9 of the 19.5 seconds. It was recorded on a computer, in Chrome, minutes apart, with the same 6 steps, not the same product. The method is in our six-step shopping trip test.
Don't put those seconds into the worksheet above: the Deloitte study measures phones, and the Equitana test was on a computer. They are there so you can see what a speed difference means for a shopper who actually wants to buy. Equitana now runs on Magento 2, Hyvä and Liquid Framework, our Hyvä Accelerator, and the results measured with real shoppers are in the Equitana case study.
Where you start: your own store's speed
To know where your store stands today, open PageSpeed Insights on a category page and read the real-user section, not the score. It covers the last 28 days, at the 75th percentile. Google rates a Largest Contentful Paint (the moment the main content appears) of 2.5 seconds or less as good. If someone promises you an improvement, there are also five questions to ask any before-and-after.
Bring the numbers to a conversation
Filled in the rows, and row G gives you pause? Book a free 30-minute strategy call. Bring the three numbers, and we'll look together at your store's real-user data and at the pages where your shoppers lose the most time.
Get the next article in your inbox
One email a month with new articles, speed fixes and the Magento security patches worth applying.